Recently, I had a project that required some statistical analysis on a large dataset. I chose Azure’s Synapse service to manage my data ingestion process, as it offers a scalable and flexible solution for data engineering and analytics. I found their service very useful but the documentation was not very clear, especially for beginners. In this series of posts, I will show you how to use Synapse and set it up to be used in a production environment.
Step 1: Deploy Azure Synapse
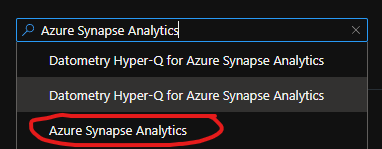
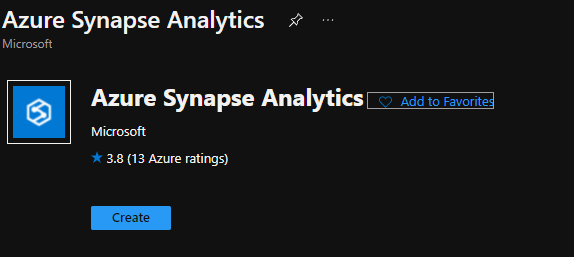
Before we begin if you haven’t already done so go into the Azure portal and create a new resource group (or use an existing one). Next, click on create and search for Azure Synapse Analytics and click create:
Now there are 4 main fields we need to fill out. The first one is “Managed resource group”. Azure Synapse has some resources that it will create and manage itself. By default, it will auto-generate a name for this resource group but I find it to be more helpful to give it a meaningful name. It’s important to remember not to touch this resource group since it should only be managed by Azure Synapse. The next field is a simple one: “Workspace name”. This field is simply what you want to call the Azure Synapse resource. Next, we have some fields for setting up a datalake. Azure Synapse requires a datalake to be set up to work. You can either use an existing one or click Create New. Similarly, within the datalake Synapse also requires a filesystem to be present. Either select an existing one or create a new one here.
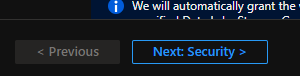
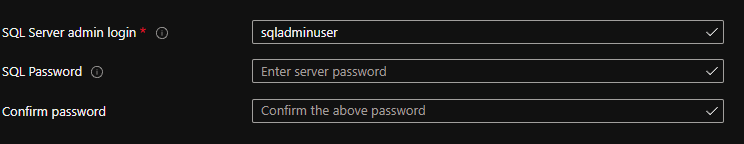
Now that we have the basic setup done one last thing we should do before creating Synapse is to set the SQL admin password. To do this click on security and fill out the fields on the next screen:
Finally, click Review + create and then click create to deploy it.
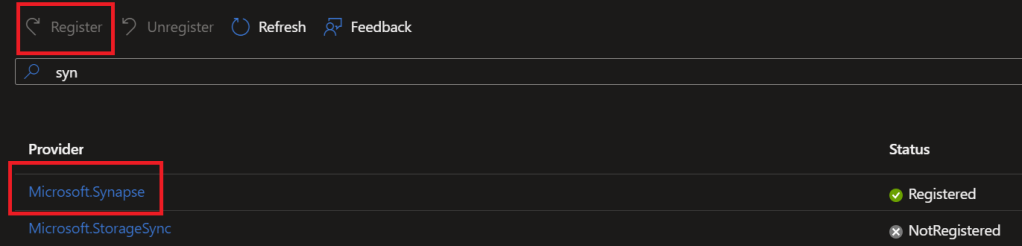
Note: If you get an error relating to resource providers you may need to enable the usage of Synapse at the subscription level. To do this go to the Azure Portal and navigate to your subscription. Then on the left click on resource providers, and search for Microsoft. Synapse, click on it, and then click register. Now try and deploy it again.
Step 2: Hello Synapse
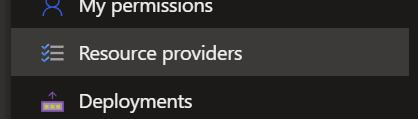
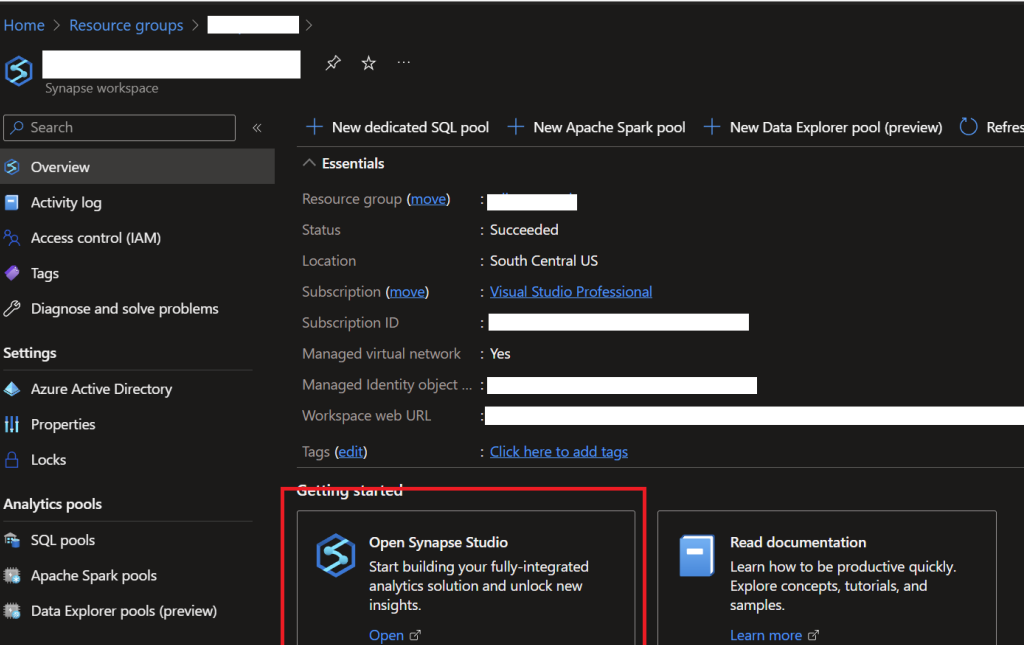
Now that we’ve deployed our synapse instance let’s take a look at what we can do. Everything in Synapse is managed through the Azure Synapse Studio. To open this go to the Azure Portal and navigate to your resource group. Click on the synapse resource and then in the overview tab click open:
This will open a new tab with Synapse Studio. Synapse is broken down into 5 main sections:
1. Data
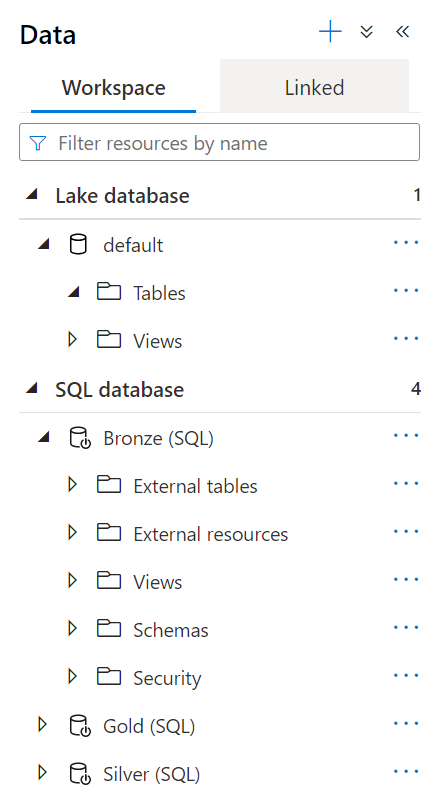
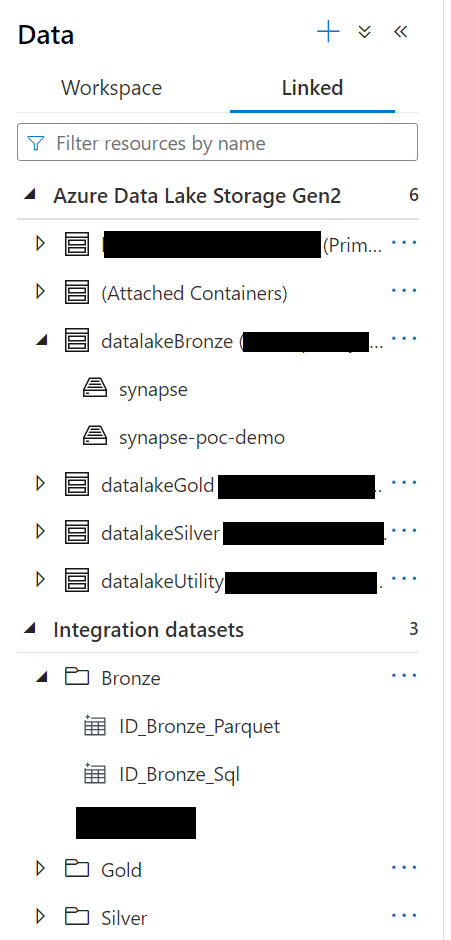
This tab is where you can create and explore the various data sources that you will use elsewhere. The data tab itself is broken into 2 parts. The workspace tab which will show your databases (serverless, dedicated, and lake). You can look at the structure of your databases here and is an easy way to run a quick select query on a table or view. Below you can see an example where I have 3 separate serverless databases for each data layer (more on this later). The second tab is the linked service tab. This tab is where you can look at data that exists in a particular linked service. This tab is also where you can create integration datasets which are predefined datasets based on a particular linked service. For example, maybe you have a user dataset that comes from a SQL database. You can create an integration dataset that can be used to easily reference this data elsewhere without having to define where the actual data lives every time you want to use it.
2. Develop
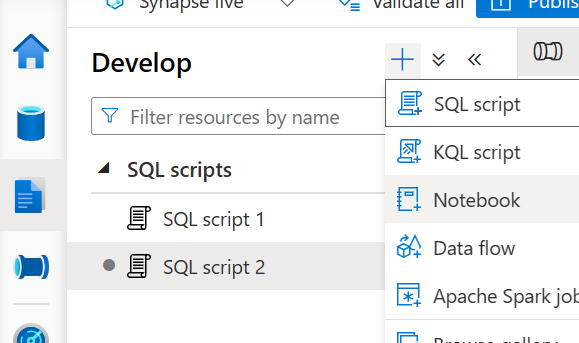
The next main tab is the develop tab. This tab is broken into several sections that will show up as you add more items to it:
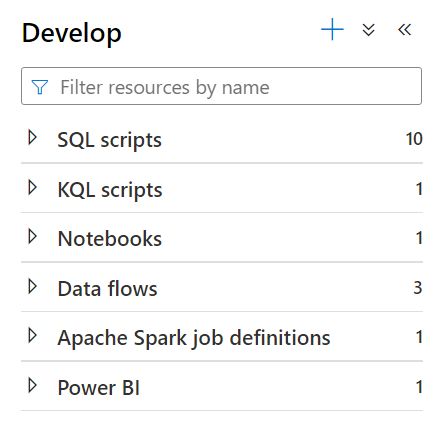
The SQL scripts section is where you can write SQL scripts to explore the data that Synapse has access to. This could be accessing data directly from the storage account or via your tables and views. You can also use scripts to modify and create databases in Synapse here. These scripts cannot be run programmatically but are a useful way to explore data in the synapse.
Similar to the SQL script section the KQL script section is where you can write Kusto queries to explore data.
The notebooks section allows you to create Spark-based notebooks to process data. Notebooks can be run manually or orchestrated via pipelines and allow you to write code in various languages including Python, Scala, C#, SQL, and R. You can use this code to interact directly with linked services or with the lake database (this is slightly different from the SQL databases).
As an alternative to notebooks, you can use the Apache Spark job definitions section to run predefined scripts in Python, Scala, C#, or F# that utilize Spark. These scripts are typically only executed via pipelines but can provide a way to write more testable code that can still be orchestrated through Synapse.
Note: For both notebooks and spark job definitions you will need to create a spark pool for them to use as I’ll demonstrate later.
Next, we have data flows. Dataflows are a way of moving and transforming data in Synapse via a visual flow. These run on a built-in spark cluster under the hood and can be run programmatically via pipelines (more on those later). Unlike SQL scripts and notebooks/spark jobs, you don’t need any programming skills to create complex data workflows.
The final section of the develop tab is Power BI. By default this section will not show up unless you have previously created a linked service for PowerBI. This section allows you to view a PowerBI workspace and manage datasets and create reports all from within Synapse.
3. Integrate
The 3rd tab is the integrate tab. This tab is dedicated to managing pipelines. Pipelines are the orchestration tool of Synapse. With pipelines, you can chain together various actions such as dataflows and SQL scripts to move and transform your data. Pipelines can be run manually or triggered via events or a schedule. They are extremely flexible and integrate with a vast number of other tools including Azure Functions, Databricks, Azure Machine Learning, and so much more.
4. Monitor
As the name suggests the monitor tab is where you can go to see a history of synapse’s usage. You can see past and current runs of various actions like data flows, pipelines, triggers, etc. You can drill into them to see the details of what happened. In pipelines, you can see the various inputs and outputs of tasks and see how things are being used.
5. Manage
The final tab is the manage tab. This tab is where you will configure most of Synapse. Here is a quick breakdown of each section:
- SQL pools – This section lets you create dedicated SQL pools as well as lets you manage the built-in serverless pool.
- Apache Spark pools – This section lets you create and manage Apache Spark pools which are needed for notebooks and spark jobs.
- Data Explorer pools – This section lets you create and manage data explorer pools used by Kusto query scripts.
- Linked Services – This is probably one of the most important sections of the manage tab and is where you connect Synapse to your various other services. This is where you define connections to things like your datalake, a SQL server, Keyvault, PowerBI, etc.
- Microsoft Perview – Connect your Microsoft Perview account to Synapse here.
- Triggers – The triggers section is where you create and manage all of your triggers that can be used by pipelines. You can create several different trigger types including schedules, tumbling windows, storage account events, or custom events from an event grid topic.
- Integration Runtimes – This section is where you define the actual runtimes that your pipelines and linked services will use for compute. By default, you get a runtime called the AutoResolveIntegrationRuntime but if you need more compute, you can create additional Azure-based runtimes here. Additionally, if you need to access data on-prem you can create Sel Hosted integration runtimes which you can use to access on-premise resources.
- Access Control- This section is where you can give users and groups access to do various things inside Synapse.
- Credentials – The credentials section is where you can create a set of reusable credentials that can be used by Synapse to access various other resources. Using access control you can limit who has access to what credentials allowing you to increase security.
- Managed Private endpoints – This section won’t always show up unless you create Synapse with a managed private network. This section will allow you to create private endpoints that Synapse will use to talk to your various resources over a private network I will go into more detail on private networking with Synapse in a future post as it’s a fairly complex topic.
- Workspace Packages – This section is where you can upload additional libraries for your notebooks. By default, there are many good things already included but in case you need an additional library or a specific version you can use this section to manage them here.
- Dataflow Libraries – Dataflow libraries is where you can create your own reusable data flow blocks. You can create custom functions that you can then use in any of your dataflows.
- Apache Spark Configurations – Use this section to create and manage reusable spark configurations.
- Git Configuration – This section is where you can connect Azure Synapse to source control. This will let you manage what is actually running in live mode via a more strict SDLC process. You can require pull requests and code reviews before publishing live pipelines, scripts, or dataflows.
Building Our First Data Pipeline
When you first look at Synapse it can be a bit overwhelming with all of the tools you have. Once you start using them, however, you’ll get the hang of it pretty quickly. To demonstrate this, we’ll create a basic data pipeline that uses each of the 3 major development tools: Serverless SQL scripts, data flows, and PySpark-based notebooks. Our data pipeline will look like this: We will start by copying a predefined dataset from Microsoft into a database called the bronze layer. We will then use serverless SQL scripts to explore the data and then. We will then clean up the data and copy it to another database called the silver layer using data flows. Finally, we will create some meaningful metrics and copy them to a database called the gold layer using Spark notebooks. This will demonstrate a common way of managing data called the medallion lakehouse architecture which you can read more about here.
Step 1: Get the source data
To begin we need to get some initial data into our datalake. There are many different ways you could go about this including just uploading files directly to the storage account. However, to make things a little more realistic we’ll use a pipeline and pull data from an external data source (in this case a dataset provided by Microsoft).
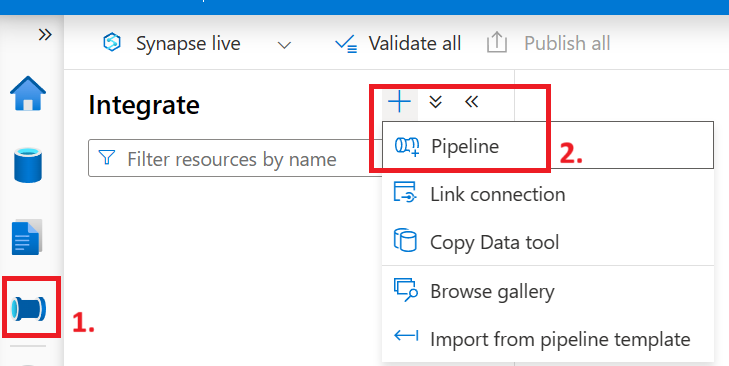
Go to the Integrate tab mentioned earlier and create a new pipeline.
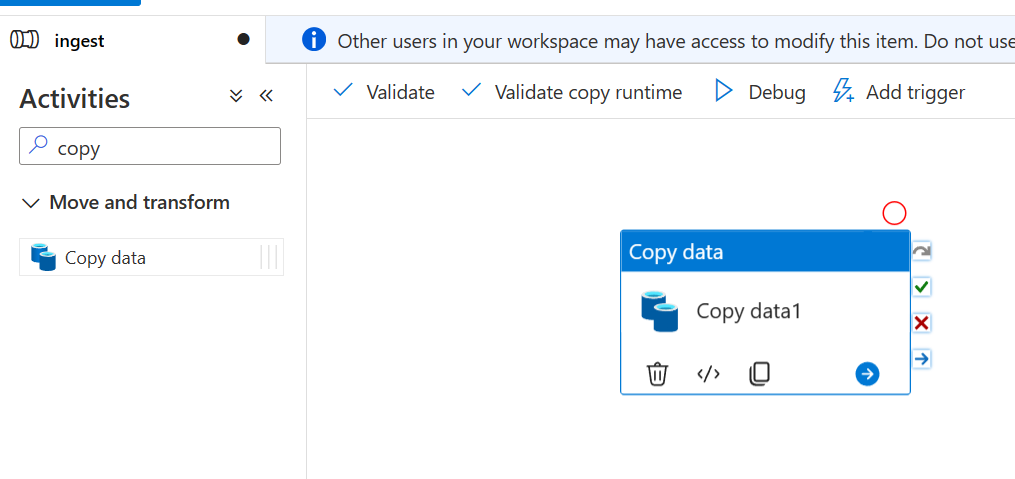
Now in the activities tab search for the “Copy data” task and drap it onto the canvas in the middle:
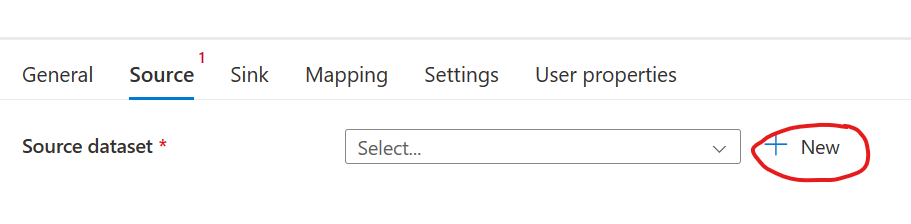
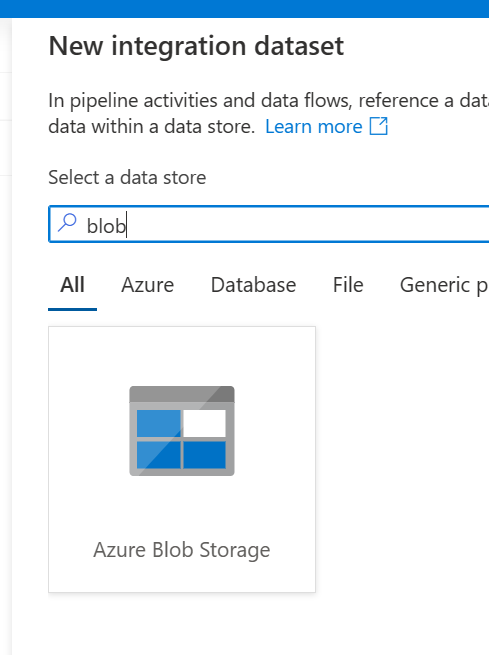
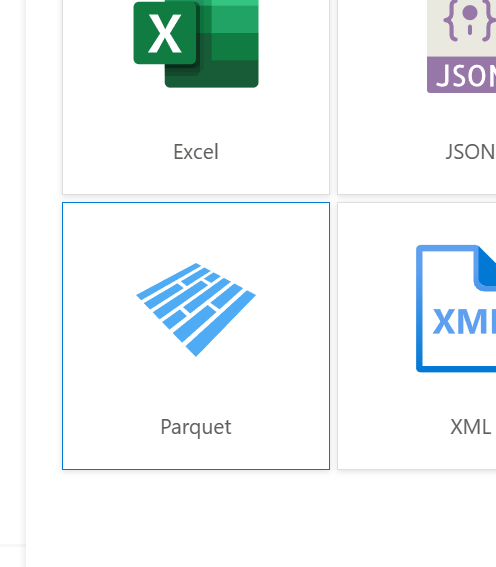
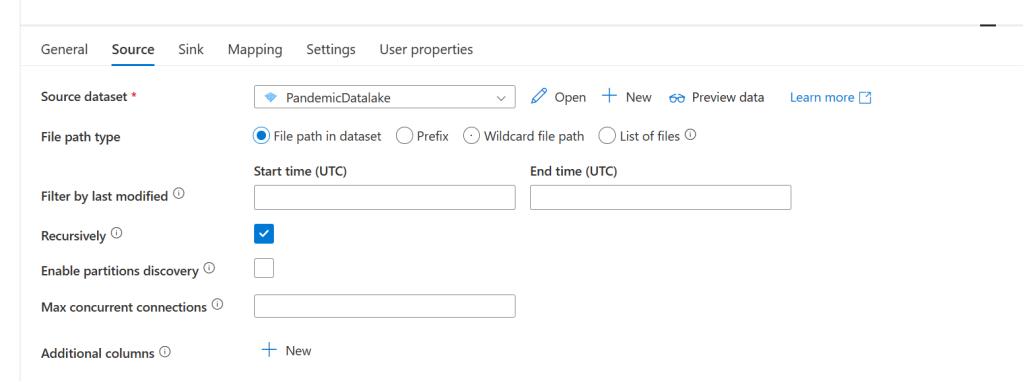
You should now see several tabs on the bottom half of the screen. This is where we can configure the task. Go to the source tab. Now we haven’t created a dataset for this yet, so we’ll do that now. Click the new button under the Source dataset. Search for blob and select Azure Blob Storage. Click continue and then select Parquet for the format.
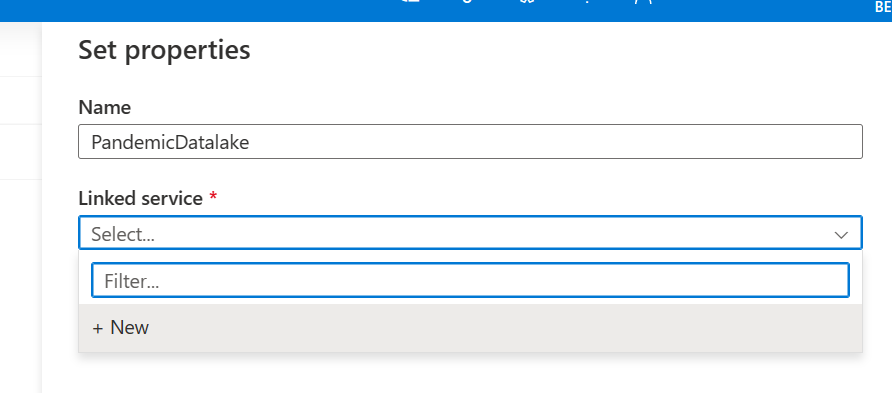
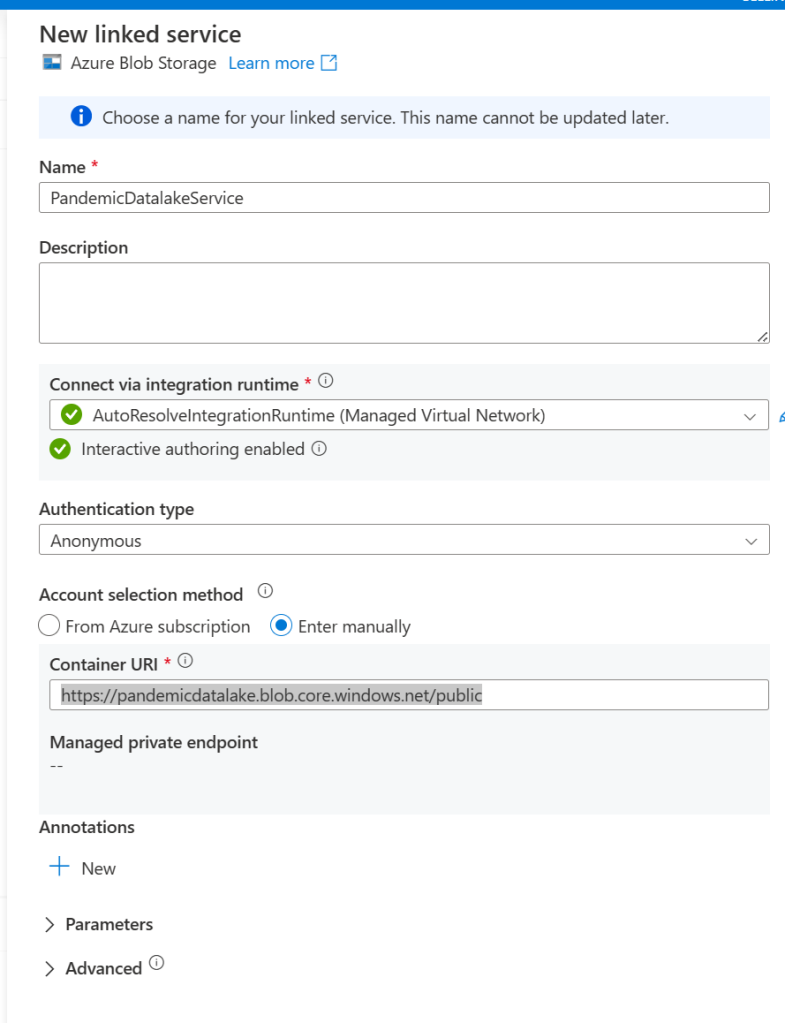
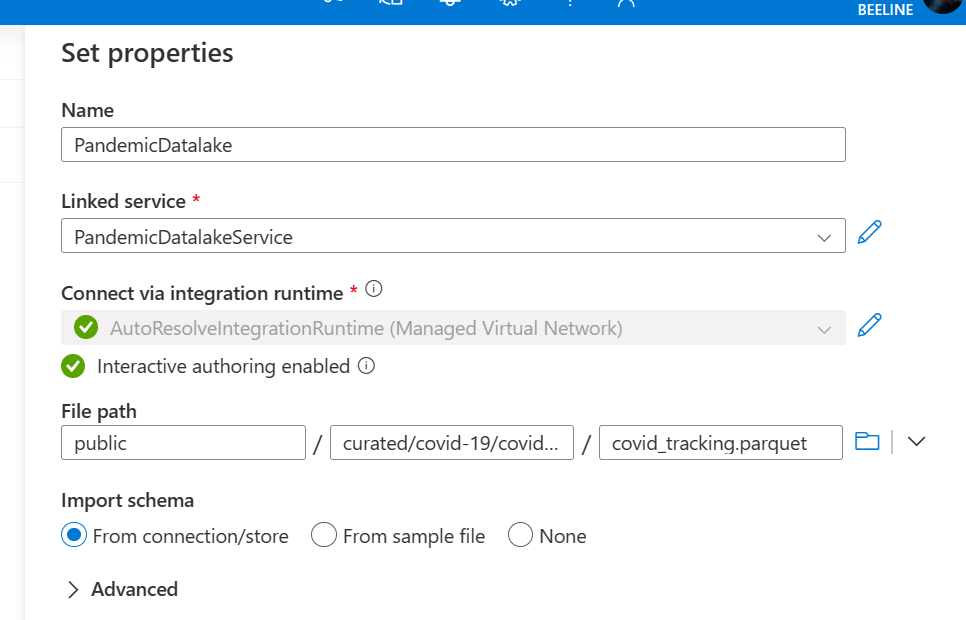
Click continue again and then give the dataset a name (in my case I’ll call it PandemicDatalake). Next, under the linked service drop down select new. Give the linked service a name (I named mine PandemicDatalakeService) and then select the anonymous authentication type. For the account selection method select enter manually and then paste this URL under container URI: https://pandemicdatalake.blob.core.windows.net/public
Click create which should take us back to the set properties tab of the new dataset we are creating. Under the file path make sure that the first box has the word “public” in it. For directory add curated/covid-19/covid_tracking/latest. Then for the file name put covid_tracking.parquet. Finally, for import schema select None and click ok.
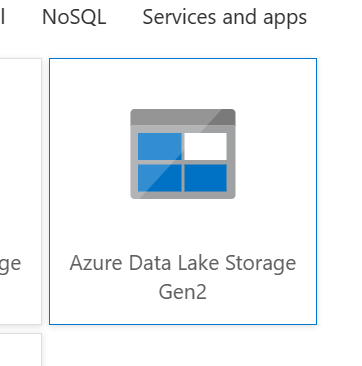
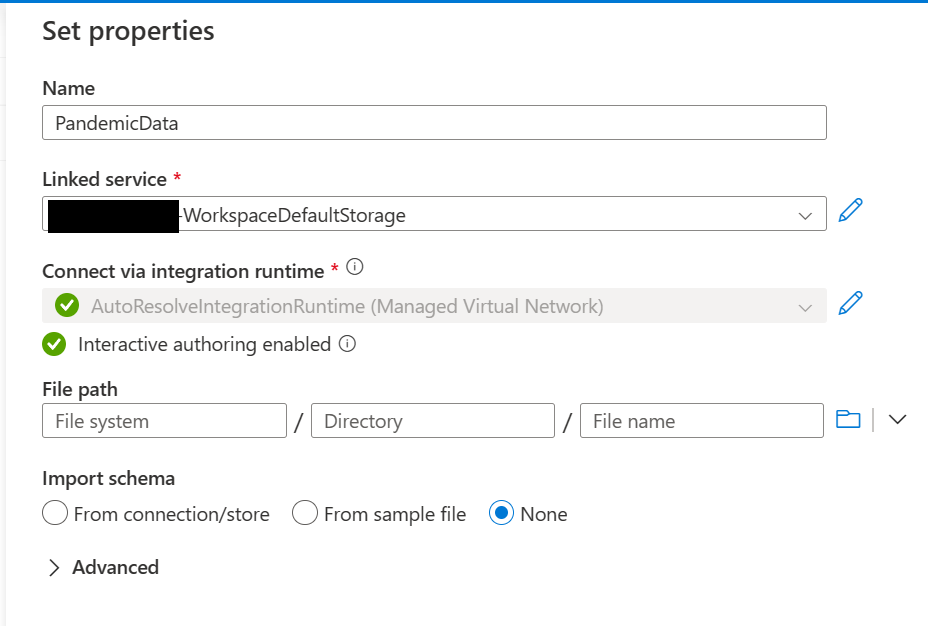
Now that our source is set up we need to set up our sink (this is where the source data will get put). Go to the sink tab and click new again. This time select Azure Data Lake Storage Gen2. Select Parquet again for the format and give it a name.
This time we’ll use an existing linked service. So click the drop-down and select the one that ends in WorkspaceDefaultStorage. For the file system enter bronze, for the directory enter, PandemicData, for the schema again select None and click ok.
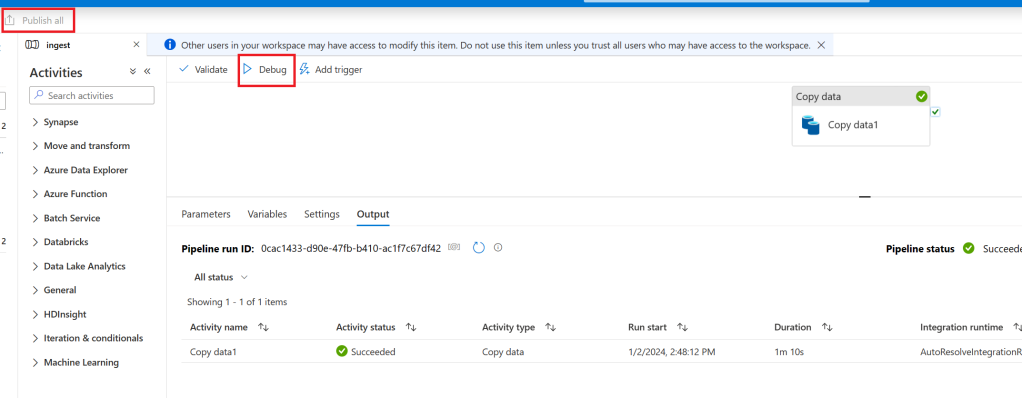
We are now finally ready to get some data! Before we do let’s go ahead and publish our changes which will save them to the workspace. To do this click the publish all button at the top of the screen. Once that completes click debug and wait for it to finish. Assuming you’ve done everything correctly the copy should succeed:
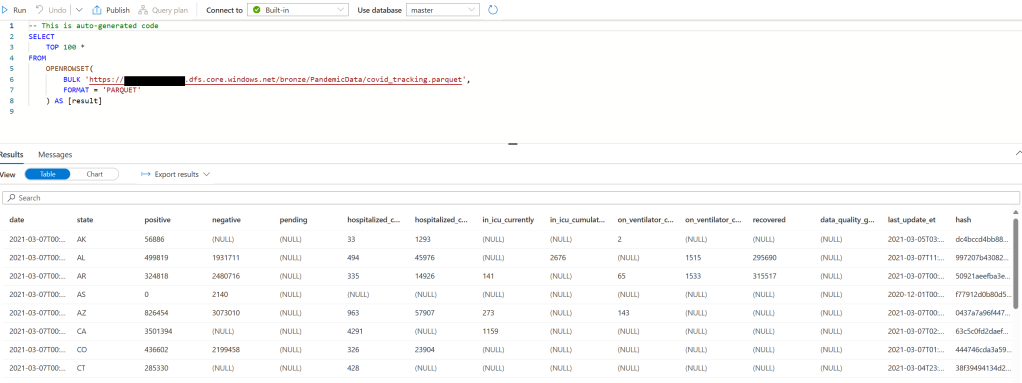
Now let’s go see the data that we just got. Navigate to the data tab and go to Azure Data Lake Storage Gen2 -> synapse name -> bronze. Now on the right double-click on the PandemicData folder, right-click on the parquet file, and select new SQL Script/select top 100 rows.
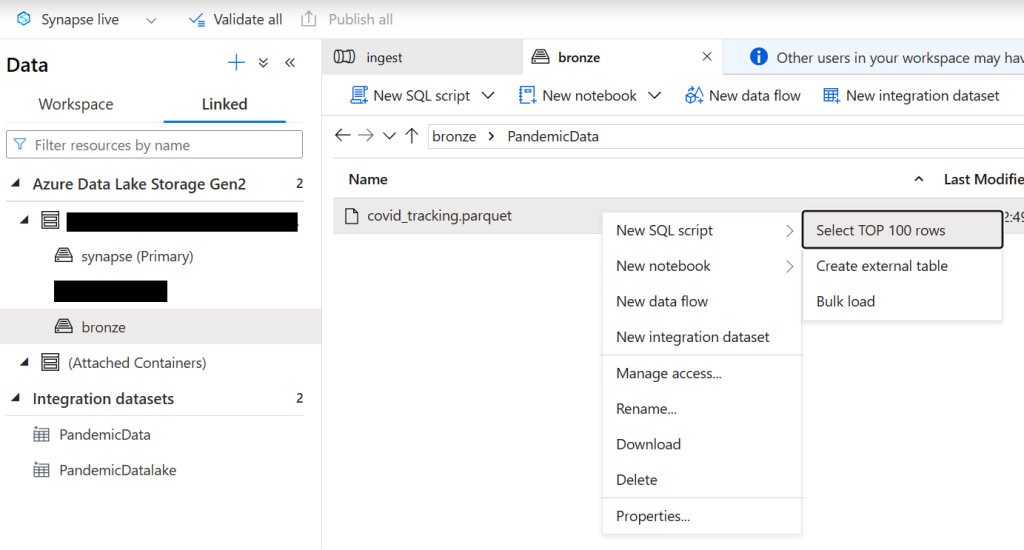
Note: If you don’t see the bronze container hover over Azure Data Lake Storage Gen2, click the ellipsis, and click refresh.
Now click run and you should see some data:
Step 2: Data Cleaning
Before we use the data for any kind of analytics we should first cleanse the data. Cleaning data is a large subject but for the purposes of this guide we’ll do the following:
- Deduplicate the data – It’s likely we will pull in data periodically which could contain duplicates. We will remove them here.
- Remove invalid data – This dataset is pretty good already but for demonstration we’ll drop a bunch of the columns we don’t care about.
- Save the data in delta format – Delta format is a very useful lakehouse data format built on top of parquet. You can read more about it here.
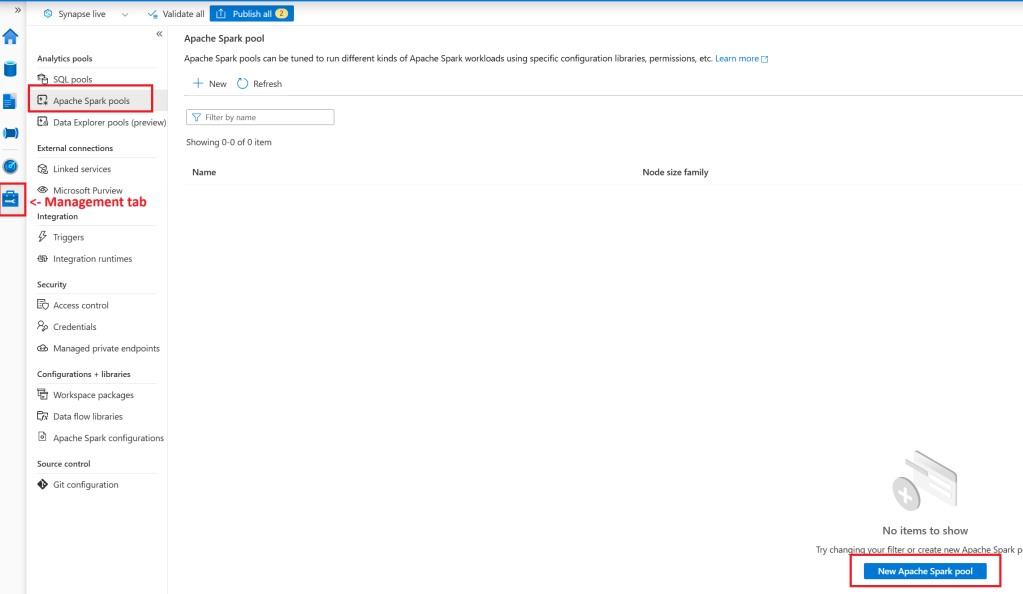
First, we’ll need to create a spark pool. To do this navigate to the management tab, click on Apache Spark pools, and then New Apache Spark pool.
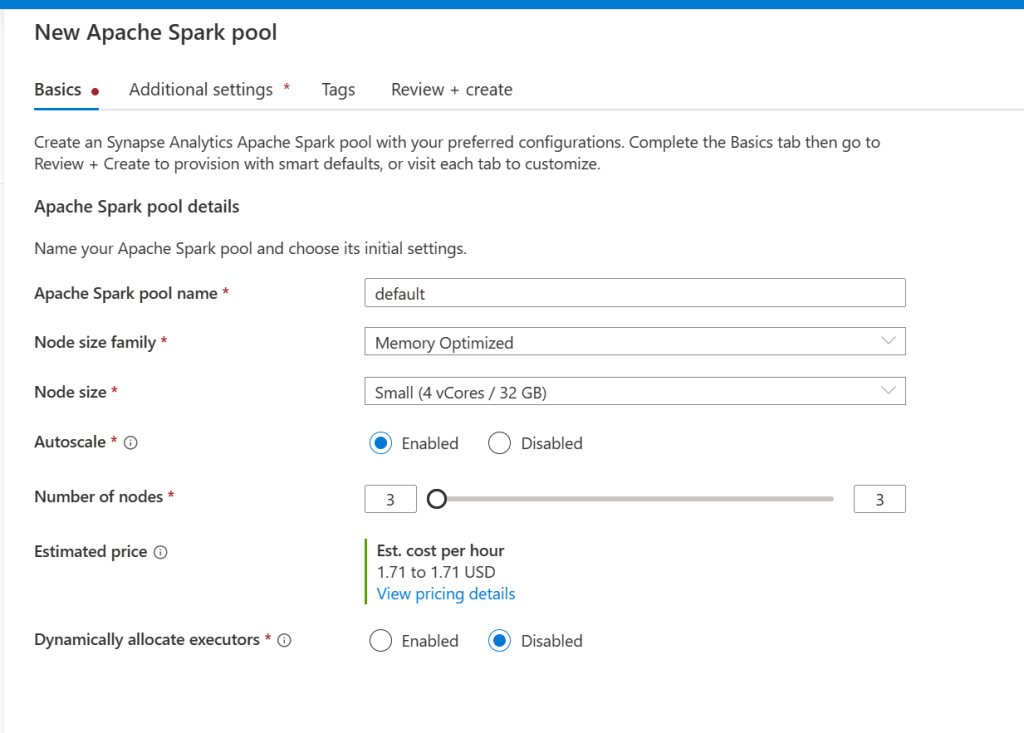
Give the pool a friendly name, select the desired node size (I recommend small until you are more familiar with Synapse), enable autoscale, and select the number of nodes (Again I recommend setting it to the minimum of 3 until you are more familiar as this can run up your costs very quickly), finally leave dynamically allocate executors to disabled and click next.
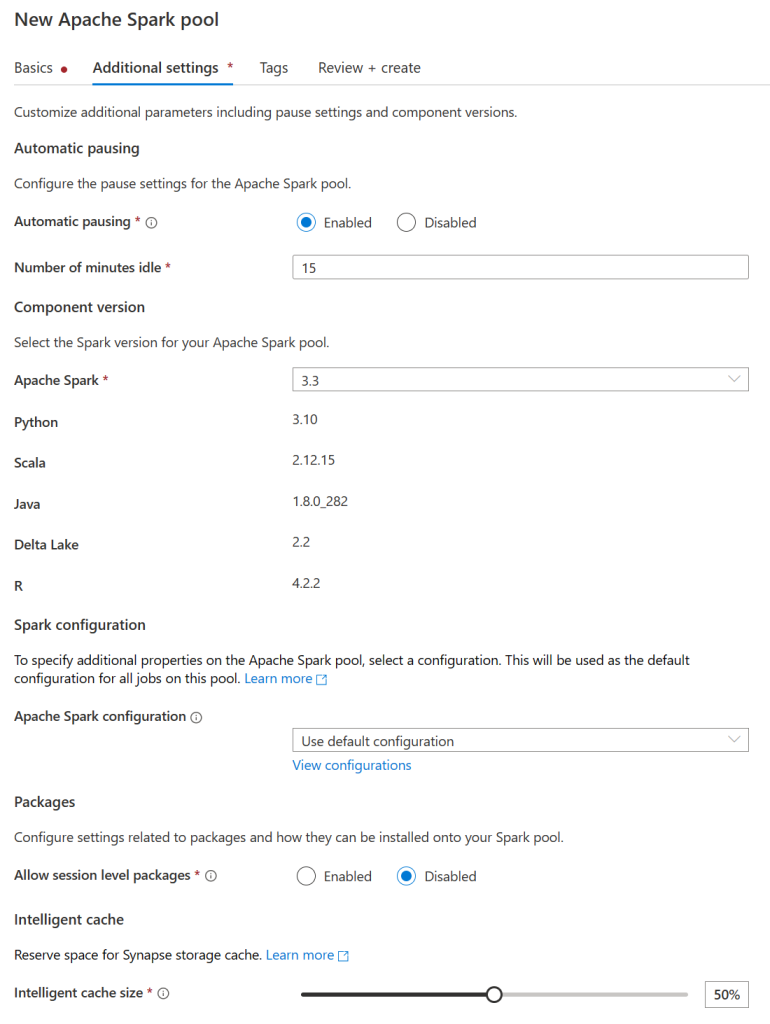
On the next page make sure that automatic pausing is enabled and select the latest non-preview version of Spark (3.3 as of the time of writing this). You can leave everything else at its defaults and then click review + create and then create.
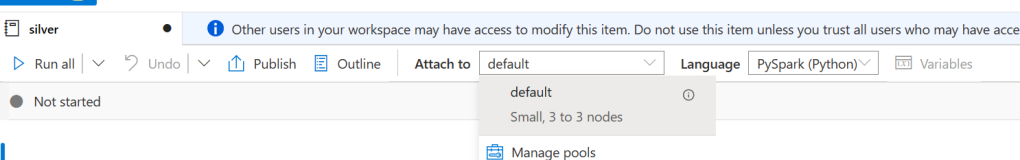
Now that we have our spark pool we can actually write our code. Navigate to the develop tab and create a new spark notebook. From the top dropdown select the new spark pool you just created and leave the language as PySpark.
Now enter the following code into the first cell (replacing <your_datalake_name_here> with the name of your datalake).
datalake_name = '<your_datalake_name_here>'
df = spark.read.load(f'abfss://bronze@{datalake_name}.dfs.core.windows.net/PandemicData/*.parquet', format='parquet')
df.show()
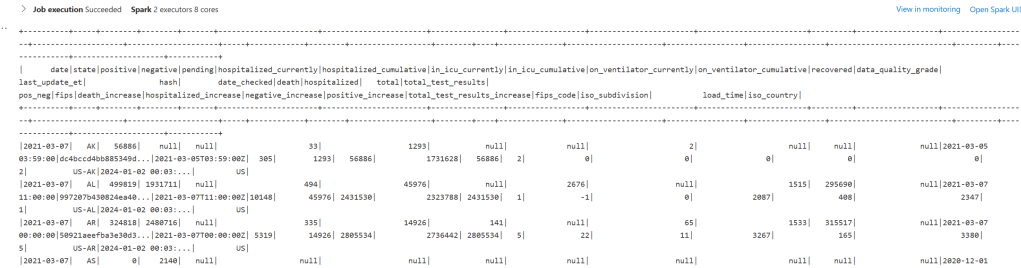
This code loads all parquet files (this is what the wildcard does) from the PandemicData path into a dataframe and then shows them. Click run all at the top and wait for it to execute. Note: The first time you run a notebook it can take 2-5 minutes to start the spark pool. You should get a somewhat ugly output that looks like this:
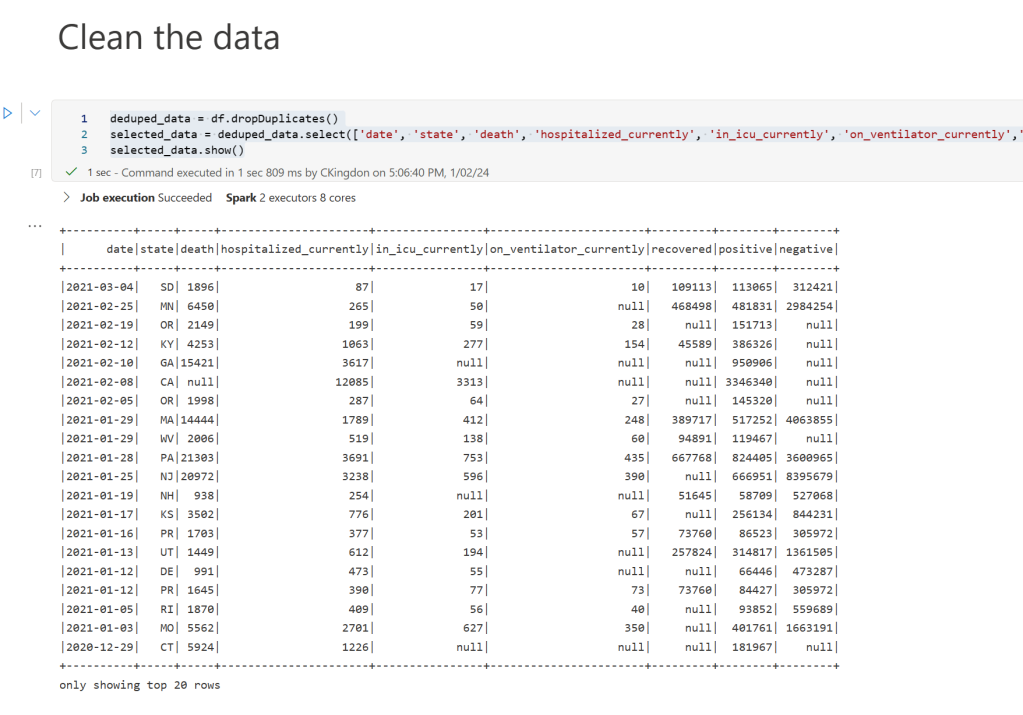
Now that we have loaded the data into memory let’s clean it. In the next cell add the following:
deduped_data = df.dropDuplicates()
selected_data = deduped_data.select(['date', 'state', 'death', 'hospitalized_currently', 'in_icu_currently', 'on_ventilator_currently','recovered', 'positive', 'negative'])
selected_data.show()
If we run this block we’ll see a much nicer-looking table:
Now let’s save the data as a new deltalake table. Add the following to the next code block:
%%sql
CREATE DATABASE IF NOT EXISTS silver
Using the double % sign we can use other spark languages. In this case, we are creating a new database called Silver. Often it’s easier to use spark SQL for simple things like this than to use Python. Now in another code block add the following code to actually save the data:
new_data = selected_data

new_data.write \
    .format('delta') \
    .mode('overwrite') \
    .saveAsTable(f'silver.pandemic_data')
The command is quite simple we take the dataframe and call write with the delta format. The mode here is overwrite which will wipe truncate the table before inserting data however alternatively we could have used merge which allows us to update rows (this is a special feature of delta lake which I won’t go into here). Finally, we give it a name. Run this code and then in the next code block add and run the following code:
%%sql
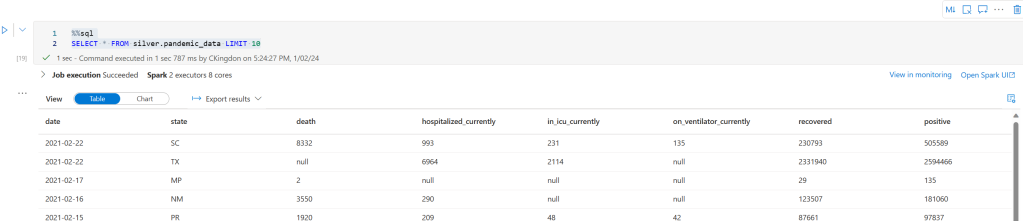
SELECT * FROM silver.pandemic_data LIMIT 10
If everything has worked you should see a similar output as follows. This proves that we now have data in the silver layer and are ready to move on to gold! Note: Don’t forget to publish everything before moving on so that it saves!
Step 3: Gold!
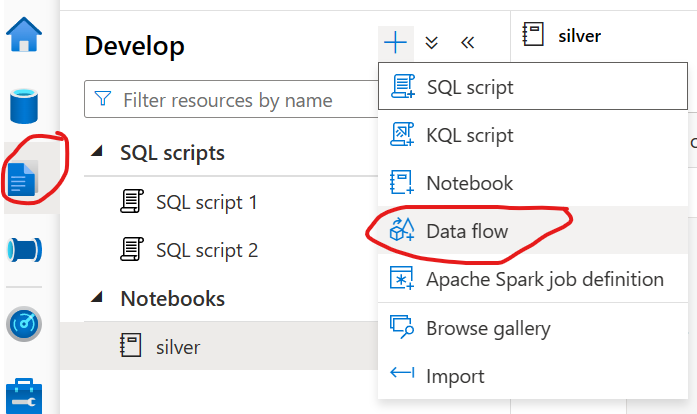
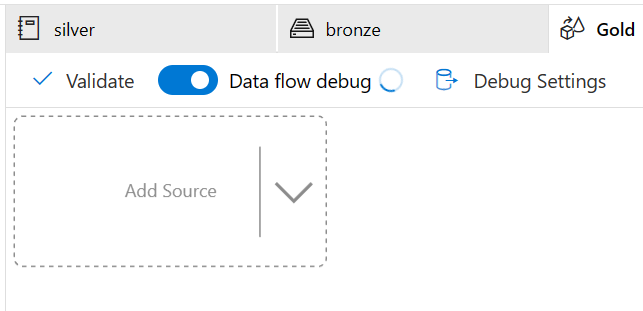
Now that we’ve got some good data to work with we can actually build out our use case. For this demo, we’ll create a new gold table that summarizes deaths by state by month. To do this we’ll use dataflows. Start by going to the develop tab and creating a new dataflow. Next, enable the dataflow debug so that we can test it as we go:
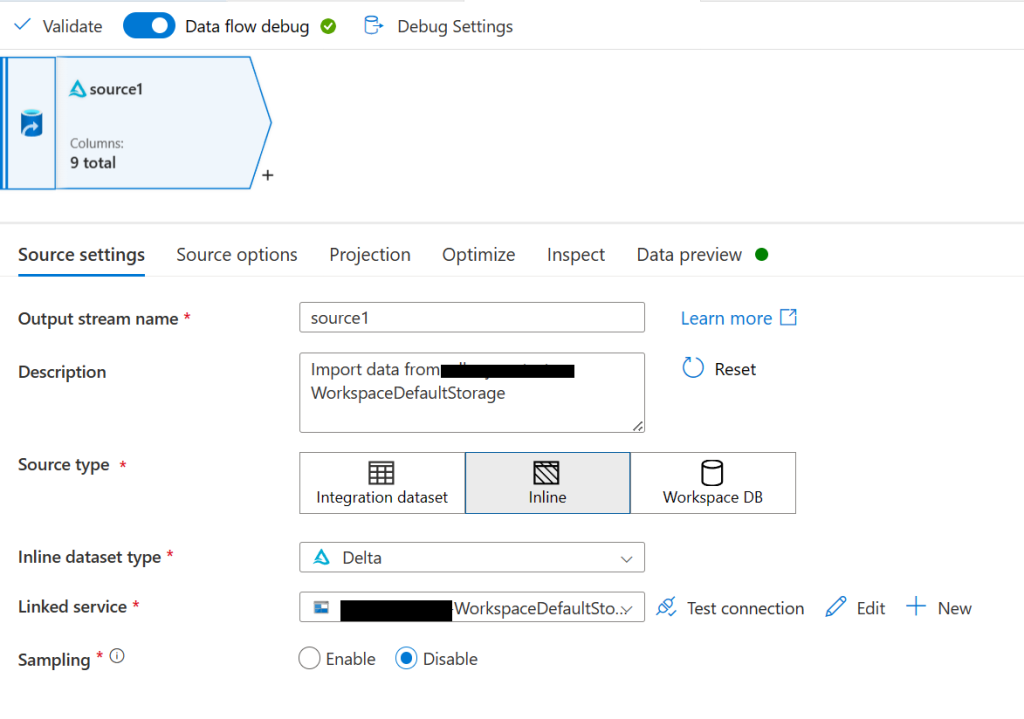
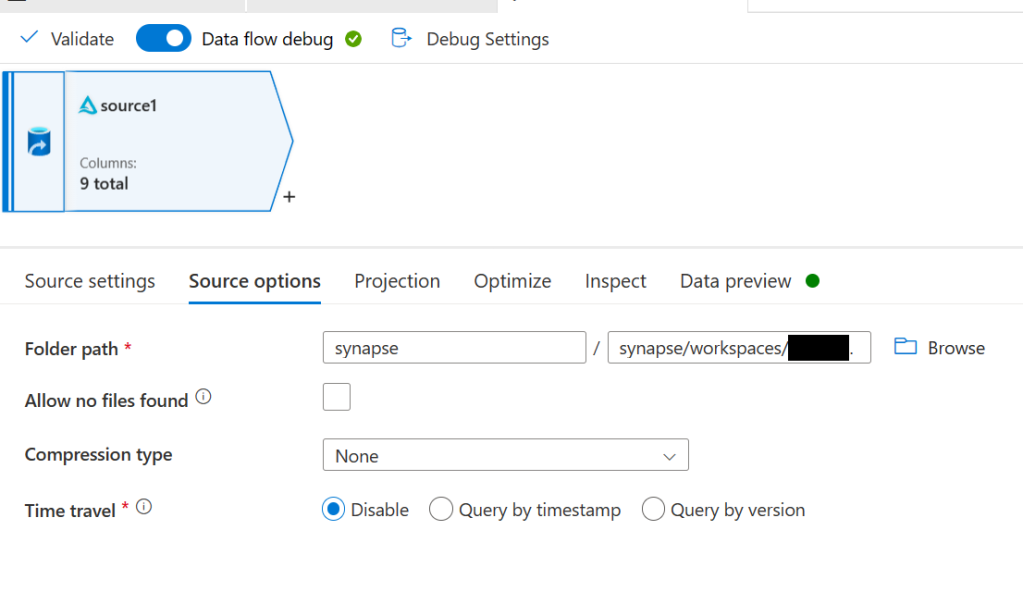
Next, add a source block. For the source type select Inline, for the dataset type select Delta, for the linked service pick the one that contains WorkspaceDefaultStorage, and leave sampling disabled. Now go to the source options tab. For the folder path enter synapse for the file system and then for the folder path enter (replace <your_workspace_name> with the name of your workspace) synapse/workspaces/<your_workspace_name>/warehouse/silver.db/pandemic_data
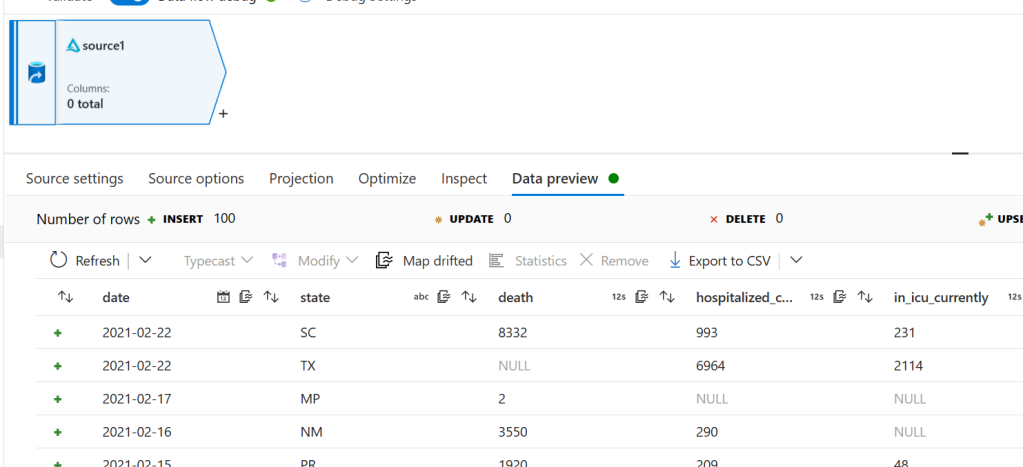
That folder is the actual place where the data in our table lives that we created earlier. To test and make sure it’s good to go head over to the data preview tab and click refresh and you should see some data (this can take a minute or so)
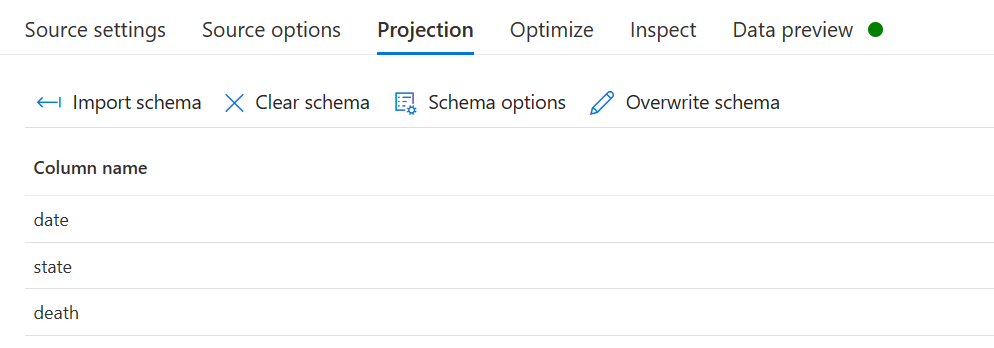
Now that we are pulling in our data let’s simplify it to only the columns we care about. First, we need to import the schema. Go to the project tab click import schema and then ok. You should now see our columns:
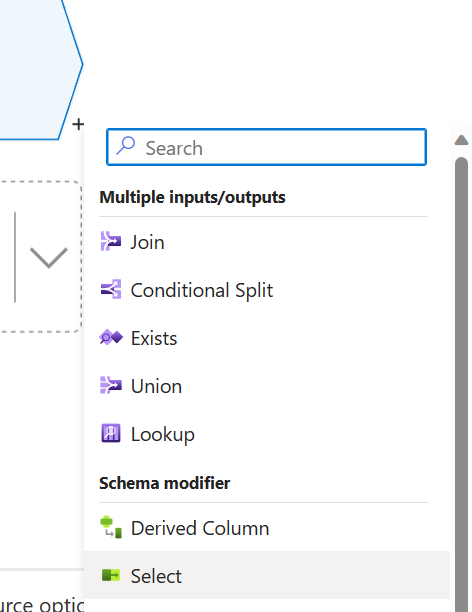
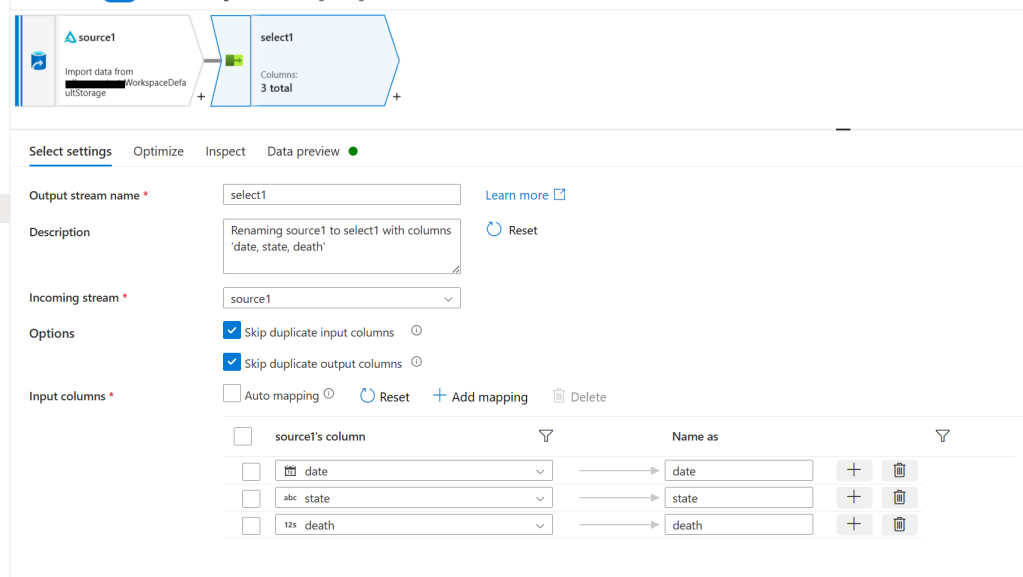
Now back in the canvas click on the + icon under our source and create a select node:
On the settings page make sure that Auto mapping is turned off and click reset if nothing has shown up yet. Then delete all columns except for date, state, and death.
Now add an aggregate node. On the settings tab under Group by add the state column. Next, click the plus sign to add another column and then click expression builder:
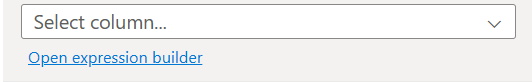
In the expression builder enter month(date) and then click save and finish. This creates an expression that will take the month component out of the date. Do this again but use year instead of month for the next column:
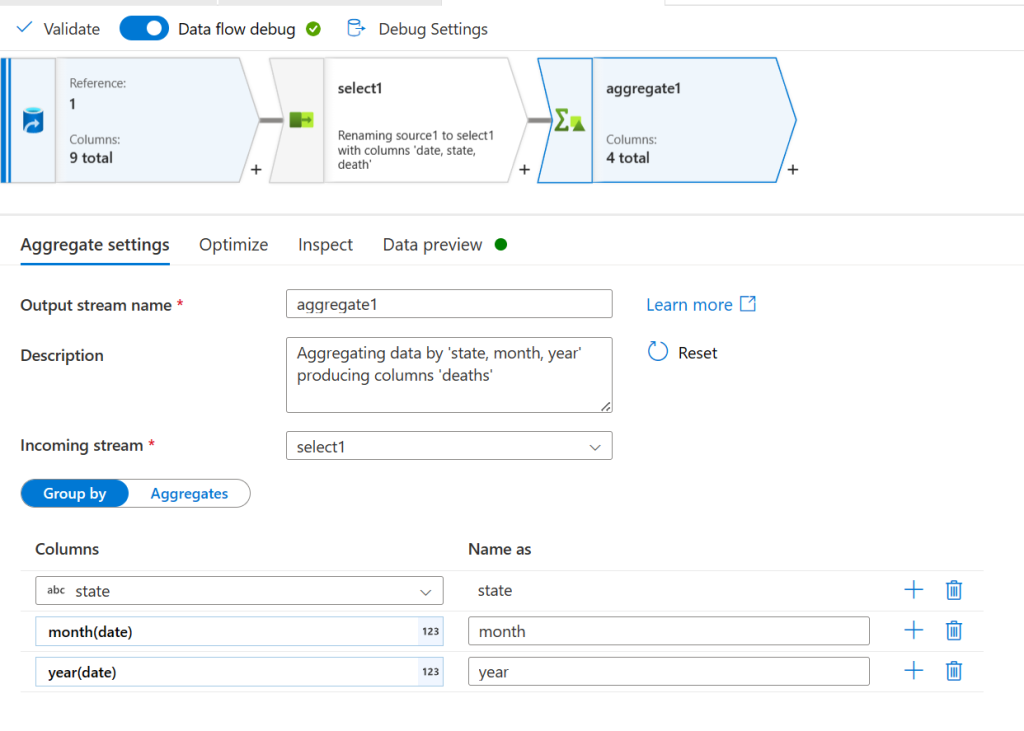
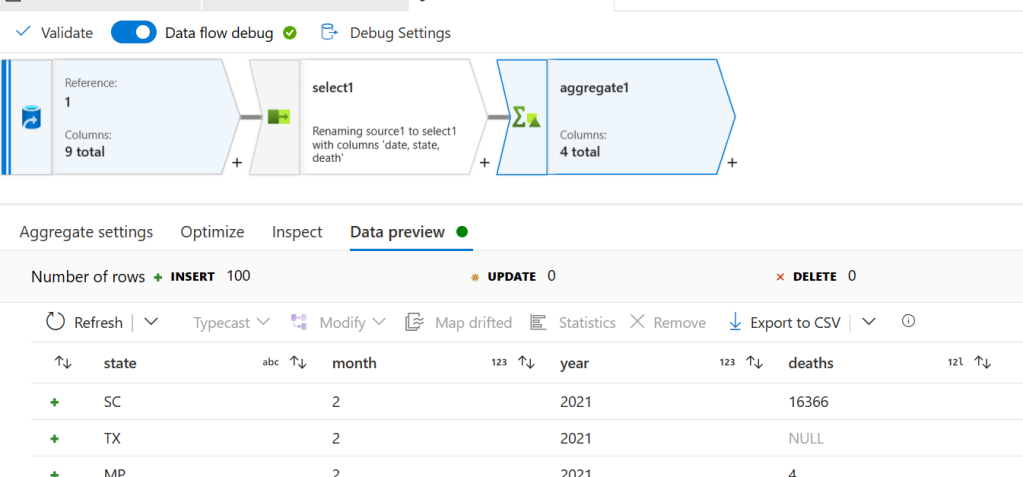
Now click the aggerates button. Add a new column and give it the name deaths on the left. For the expression open the expression builder again and this time do sum(death). Finally, go to the preview tab and click refresh to see the results:
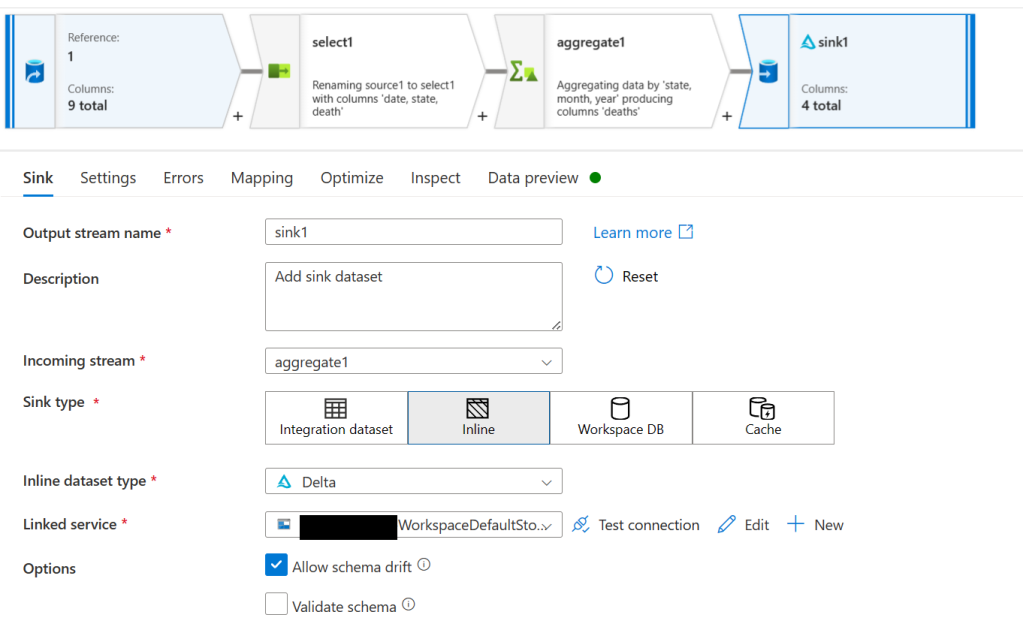
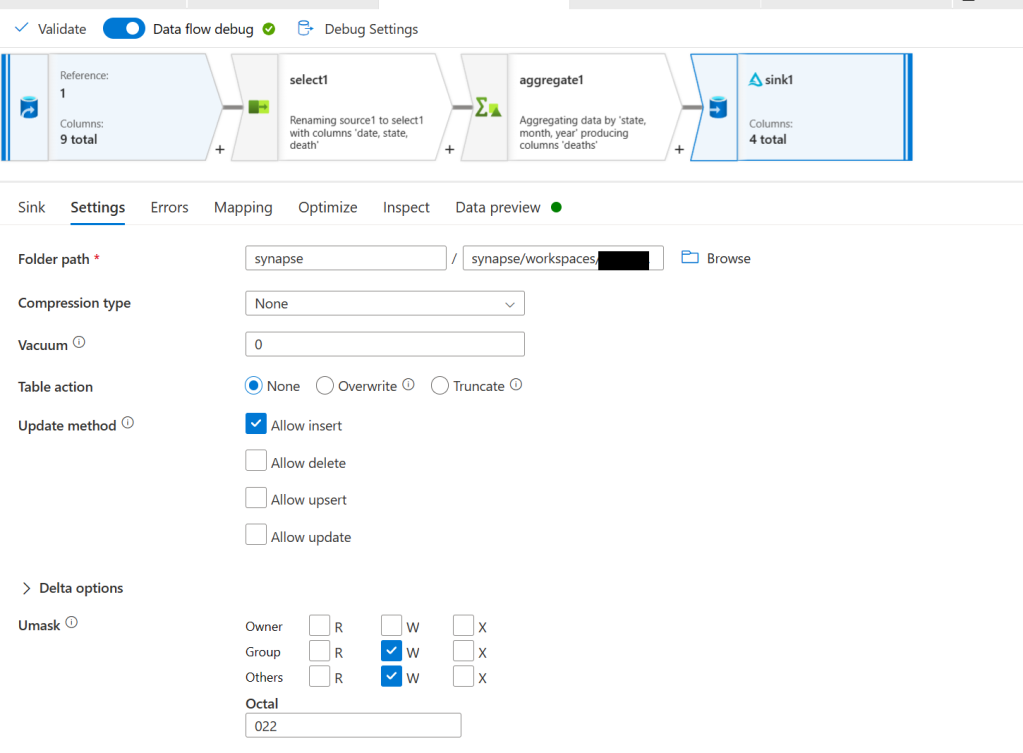
Now that we’ve got our data how we want it we need to save it. To do this create a sink node. Select Inline for the sink type and Delta for the dataset type. Select the WorkspaceDefaultStorage linked service and then go to the settings tab. On the settings tab put synapse for the file system and then put synapse/workspaces/<workspace_name>/warehouse/gold.db/deaths_by_month_by_state for the folder path.
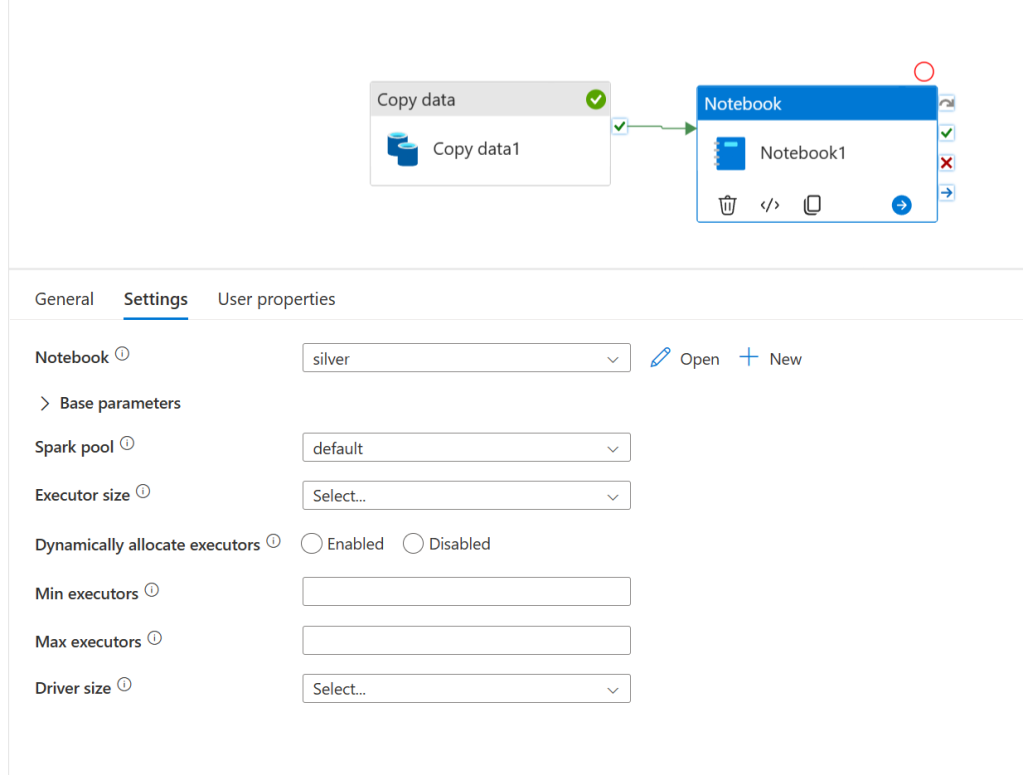
We are now ready to test this out. Publish your changes and then re-open the pipeline from step 1. We will make this pipeline now execute all 3 steps. From activities search for and then add a notebook task. Drag the green arrow from copy data to the notebook task so that it will run after. Then click on the notebooks task and go to its settings tab. Select the notebook you created in step 2 and the spark pool we created as well.
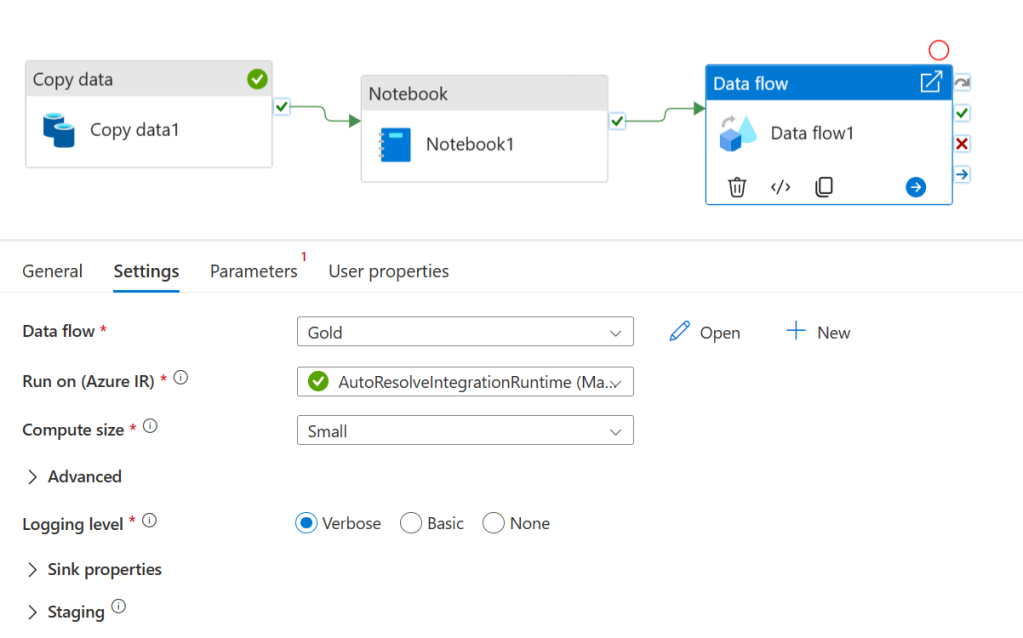
Now pull in a dataflow task and connect it after the notebook. On its settings tab select the dataflow we created a few minutes ago. Publish our changes again and then hit debug, the pipeline should run to completion.
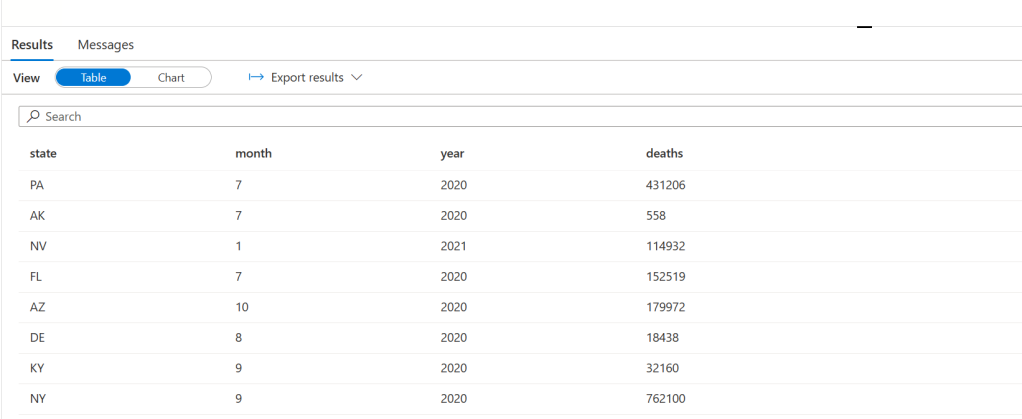
Now to bring everything to a close and prove that it all worked go to the develop tab and create a new SQL script. Enter the following code and then run it. (Be sure to replace <your_datalake_name> and <your_workspace_name>)
SELECT
    TOP 100 *
FROM
    OPENROWSET(
        BULK 'https://<your_datalake_name>.dfs.core.windows.net/synapse/synapse/workspaces/<your_workspace_name>/warehouse/gold.db/deaths_by_month_by_state/',
        FORMAT = 'DELTA'
    ) AS [result]
You should get an output similar to this:
Final Thoughts
Synapse is an immensely powerful tool and extremely flexible to whatever your needs may be. If you need to do saleable data analysis this is definitely a tool worth looking into. Its integrations with other services (especially Azure-based services) are really excellent especially when paired with the ability to manage access and permissions to data. I highly recommend testing out Synapse and seeing if it’s a fit for your data workflow. As always let me know in the comments if you have any issues or any questions!
Edit: Microsoft has recently released Fabric which seems to be a replacement for Synapse. A lot of this guide is still applicable however I’ll create a follow-up guide on replicating this in Fabric.
